Monitoring
Proxmox monitoring using #influxdb and #grafana running in a LXC container. Monitoring is a key part of the security and hardening process.


Monitoring is a must, and this is my fourth post on the subject. It's one of the security measures you do. Any drastic change in the vitals means you might have a problem. This is a quick setup you do in 30 minutes.
Installation
We need an unprivileged Linux Container (or a VM) for holding our database (Influx) and graphing app (Grafana).
Create the CT or VM
- Setup with any ID and Hostname you like
- Set a strong password
- Set the SSH Public Key
- Use any Template you like, e.g. Debian 12
- Disk 8G on local-zfs for standalone. Use a common named or a shared storage in clusters. CT migration is not grate, but for a home lab it's acceptable.
- CPU 1 core is plenty
- Memory 1024 MiB and Swap 512 MiB
- Network a fixed IP or, even better, make a reservation for it in DHCP.
Install Influx and Grafana
First, you need to upgrade the CT (VM).
apt update && apt upgrade -yThen we can install new software on our Linux Container or VM.
Install InfluxDB
apt install influxdb influxdb-clientInstall the database, InfluxDB
Configure InfluxDB
nano /etc/influxdb/influxdb.confLocate the [[UDP]] section, near the end of the file, and edit it to something like:
[[UDP]]
  enabled = true
  bind-address = "0.0.0.0:8089"
  database = "proxmox"
  batch-size = 1000
  batch-timeout = "1s"
This is a basic example. Use your own settings
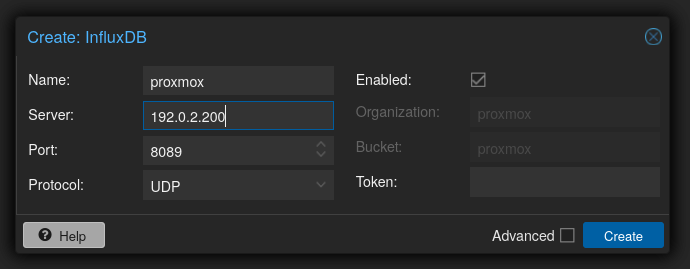
Go to the Proxmox GUI Datacenter → Metric Server, hit Add and choose InfluxDB.
Restart InfluxDB
Go to the console of the CT and
- Restart the database
systemctl restart influxdb - Enable it
systemctl enable influxdb - Check for success
systemctl status influxdb - Check for Influx basics
influx- Check for databases
show databases - Exit
exit
- Check for databases
Install Grafana
We will use the Enterprise Edition of Grafana 10.3.1 it is the default and recommended edition. It includes all the features of the OSS Edition. The license is Grafana Labs License.
apt install -y adduser libfontconfig1 muslInstall dependencies
wget https://dl.grafana.com/enterprise/release/grafana-enterprise_10.3.1_amd64.debDownload Grafana
dpkg -i grafana-enterprise_10.3.1_amd64.debInstall Grafana
- Restart Grafana
systemctl restart grafana-server - Enable Grafana
systemctl enable grafana-server - Check for success
systemctl status grafana-server
Configure Grafana
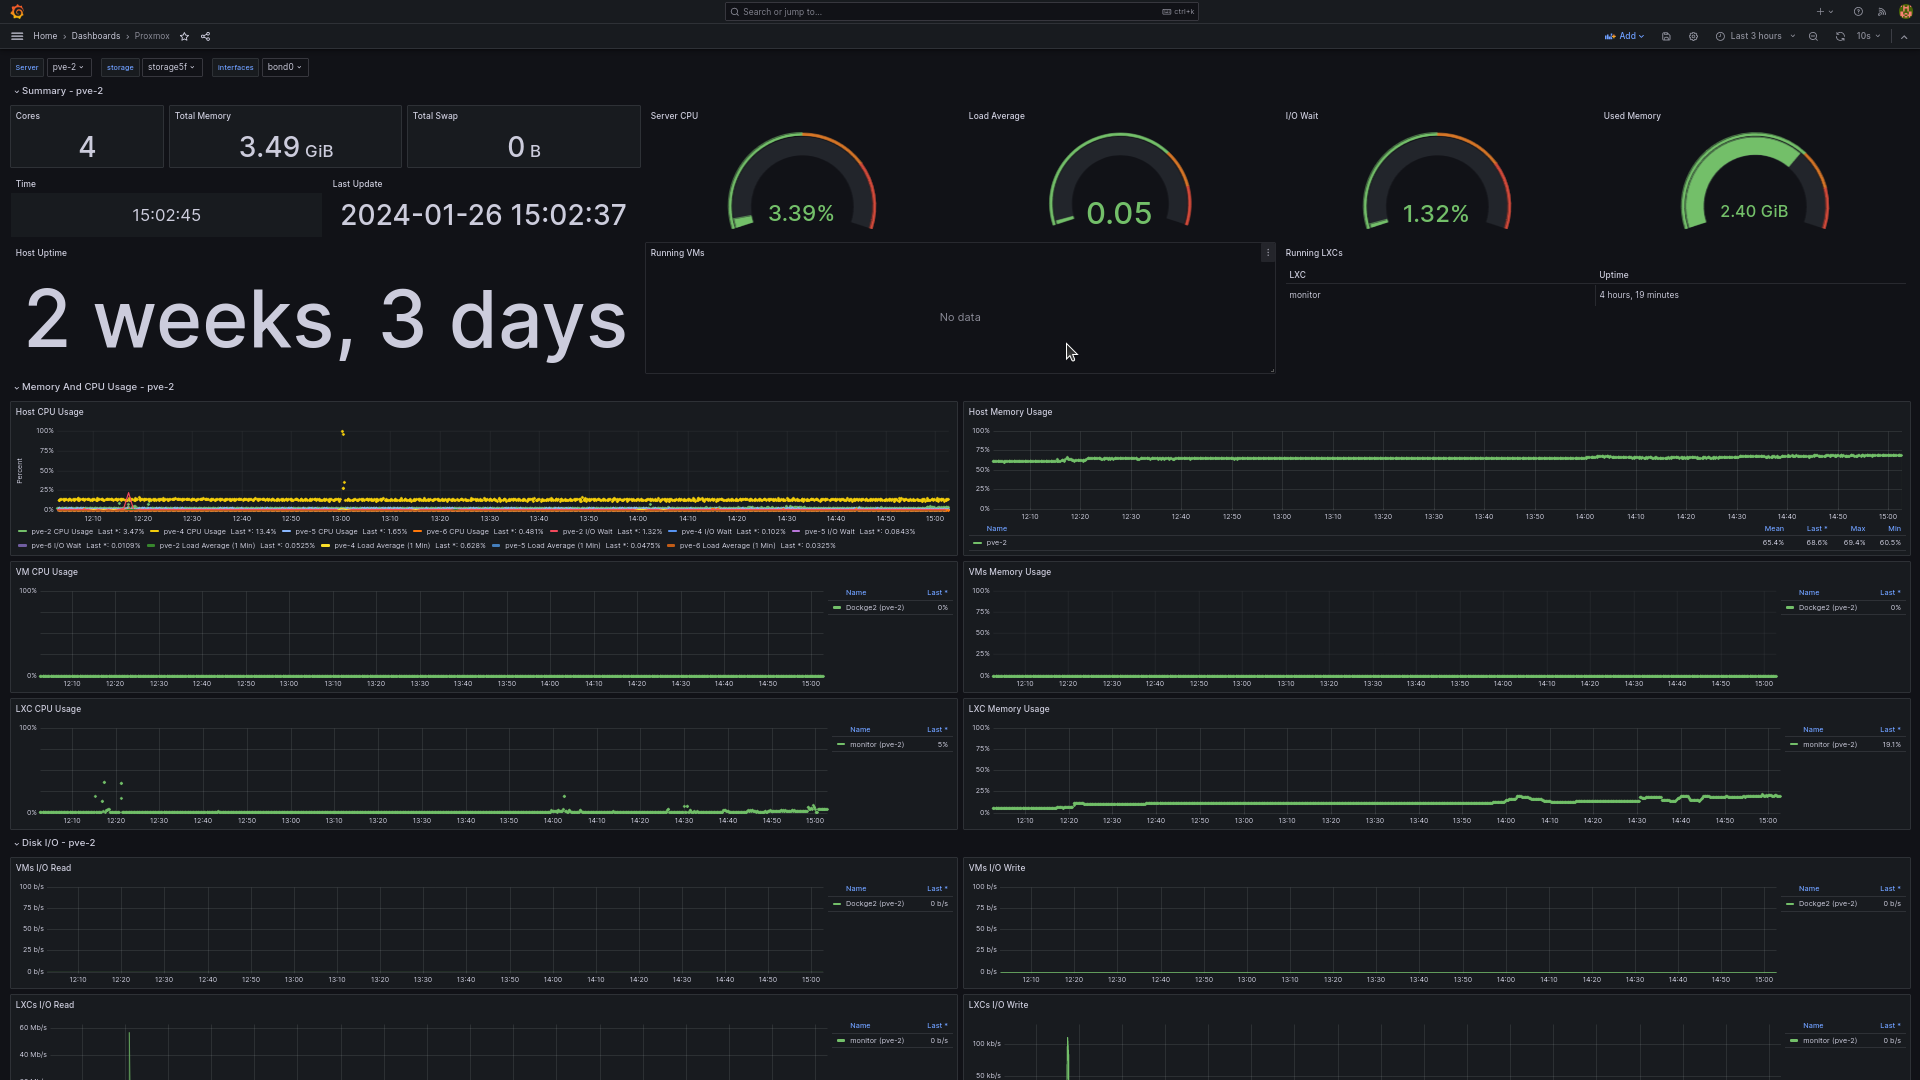
I have been using this dashboard, 10048 from Grafana Labs, but you select anyone you like from there or from GitHub / GitLab. The specs for 10048 is older than my Proxmox, Influx and Grafana, but it still works on the latest of them.
- Open browser and go to the 192.0.2.200:3000
- Login as User admin Password: admin
- Create a new strong password
- Open the Menu from the ☰ button
- Select Connections and hit Add a new connection InfluxDB
- Hit
Addnew data source, set these - Name: proxmox
- URL: http//:192.0.2.200:8086
- Database: proxmox
- hit
Save & Test button
- Hit
- Go to Dashboards and hit New and Import, we will use a JSON file
- select one of your JSON files (10048_rev4.json) and hit
Import- Set InfluxDB to
proxmoxand hitImport - If you see a red warning of no data, edit and add your Data source
proxmoxto that panel - Add any missing plugins
cd /usr/share/grafana/binandgrafana-cli plugins install grafana-clock-panel
- Set InfluxDB to
- select one of your JSON files (10048_rev4.json) and hit
- Select Connections and hit Add a new connection InfluxDB
- Restart Grafana
systemctl restart grafana-server
Security
To-Do, add tokens to protect you and all of us. All apps should be locked down.
Other Monitoring - Homepage
I use the Homepage app as my go-to dashboard. Homepage has a ton of Service Widgets, also one for Grafana.
- Grafana:
    icon: si-grafana #mdi-speedometer
    href: http://1192.0.2.200:3000/d/some id/proxmox
    description: Grafana Dashboard
    widget:
      type: grafana
      url: http://192.0.2.200:3000
      username: UserName
      password: UseLongComplicated
Service Widgets I'm using
Like the ones for: Authentik, Cloudflare Tunnels, Grafana, Gotify, Navidrome, NginX, Nginx Proxy Manager, OPNSense, pfSense, Portainer, Prometheus, Proxmox, Proxmox Backup Server, Traefik, Transmission, TrueNAS, Uptime Kuma, Watchtower, Whats Up Docker and some of the Information Widgets.
References
InfluxDB [1] Grafana [2] Dashboards [3] Proxmox GUI [4] older post with Zabbix [5] Homepage app [6]
Grafana homepage, Install on Debian/Ubuntu, download, Plugin Management, Grafana CLI ↩︎
Dashboards to test Grafana Labs 10048, 18621. From GitHub edgeuno, bennetgallein, riponmollick66, ↩︎
Proxmox Monitoring documentation ↩︎
Monitoring using Zabbix and Grafana Monitoring Servers with Graphs, same but, running on Docker Monitoring your Servers, using flux Proxmox Monitoring ↩︎
Homepage is an exellent dashboard homepage, wirgets, my post ↩︎