Monitoring your Servers
Monitoring servers and VM's is extremely important and highly productive. In real environments you constantly tweak and change setting for optimal performance and also you need to have a early warning system in place to be able to react on upcoming issues. #Zabbix #pfSense #Proxmox #Docker


Zabbix as an enterprise grade reporting and inventory tool. Monitoring servers and VM's is extremely important and highly productive. In real environments you constantly tweak and change setting for optimal performance and also you need to have a early warning system in place to be able to react on upcoming issues.
You can set it up in many ways Docker, CT, VM or on HW. I prefer to run everything as Docker containers and setup and control them by Portainer. A give a VM 8G RAM, 16G disk and 2 cores. But if more monitoring apps are to be installed you might need to up these. Zabbix is going to grab a lot of info from the servers on your network, small packages though. You need to tune the system extensively at setup but it's worth the effort - remember to document everything for a future you.
Zabbix is a good fit for monitoring Proxmox virtualization infrastructure. Zabbix can monitor both the Proxmox hosts and the VMs running on it. Zabbix supports monitoring of Proxmox using the Proxmox VE API. The API provides access to a wide range of Proxmox metrics, including CPU usage, memory usage, disk I/O, and network traffic.
To monitor Proxmox with Zabbix, you set up a Zabbix agent on the Proxmox host or use the Zabbix Proxy to monitor multiple Proxmox hosts. The Zabbix agent or Proxy can then use the Proxmox VE API to collect metrics and send them to the Zabbix server for processing and analysis.
I also have a post on using InfluxDB and Grafana Monitoring Proxmox.
Table of Contents
- Get the tools
- Environment configuration
- Configure the docker-compose
- Start the Zabbix server container
- Set Zabbiz
- Add Zabbix agents to your servers
- Add the Zabbix Server as target for the Zabbix Agent
- Examples
- References
1. Get the tools
Set up a VM for your Zabbix server or use one already up and running. The needed apps on that VM is: git, wget, Docker, Docker Compose, Portainer
Docker
For VM see my blog Proxmox Automation and my script. wget https://raw.githubusercontent.com/nallej/MyJourney/main/myTemplateBuilder.sh
You should also check for open ports sudo lsof -i -P -n | grep LISTEN
Zabbix
Go to your docker stack and download or clone the zabbix repo git clone https://github.com/zabbix/zabbix-docker.git
sudo apt-get update && sudo apt-get install -q docker-ce -y
sudo apt install -q docker-compose -y
Portainer
Restart Portainer docker restart portainer and create the admin user.
You can now set up Zabbix Server in Docker by Portainer or manually.
2. Environment configuration
Tho customize the Zabbix you need to set passwords and maybe you like to set some other things specific to your lab.
Go to the cd docker-stack/zabbix-docker/ and make a copy of the yaml/file you choose to run cp docker-compose_v3_alpine_mysql_latest.yaml docker/compose.yml
Go to the sub folder /env_vars and configure your user and the passwords and any other parameter you like to set. Remember to use a long 20-30 character long password.
Special characters may cause issues if you do not use quotes around them, if you use upper and lower characters with numbers you are safe from those errors, but remember to make the password long.
3. Configure the docker-compose
This is a very long file. The thing you need to look for is ports to be opened used and correct according to your environment. Basic configuration uses ports: 10050, 10051, 10052, 10061, 10071, 80, 443, 8081, 8443 and 162. If you didn't run it yet, please do it now sudo lsof -i4 -P -n | grep LISTEN for IPv4 ports.
4. Start the Zabbix server container
This step will take a longer time due to the number of downloads and things needed to be setup - just grab a coffee and wait. Start the container by:docker-compose up -d && docker-compose logs -f
And if needed, wait some more.
When you can login at http://yourIP add a user other than Admin (psw zabbix)
You are now ready to begin enrolling devices into your new monitoring system. Zabbix is a massive system with an incredible amount of power. Take your time, read the documentation, get to know what all it's capable of doing, and what information you can gain.
5. Setup Zabbix
Login to your new Zabbix Server. There is a ton of settings to play with. Please consult the documentation for more info. I will share some examples.
6. Add Zabbix agents to your servers
Download and start the agent on your server. Then run the find in Zabbix Server
Install on Debian based distros by sudo apt-get update && sudo apt-get install zabbix-agent
Zabbix agent uses the following ports for its traffic:
- 10050 - Passive mode is used for infrastructure
- 10051 - Active mode is used for ie. laptops.
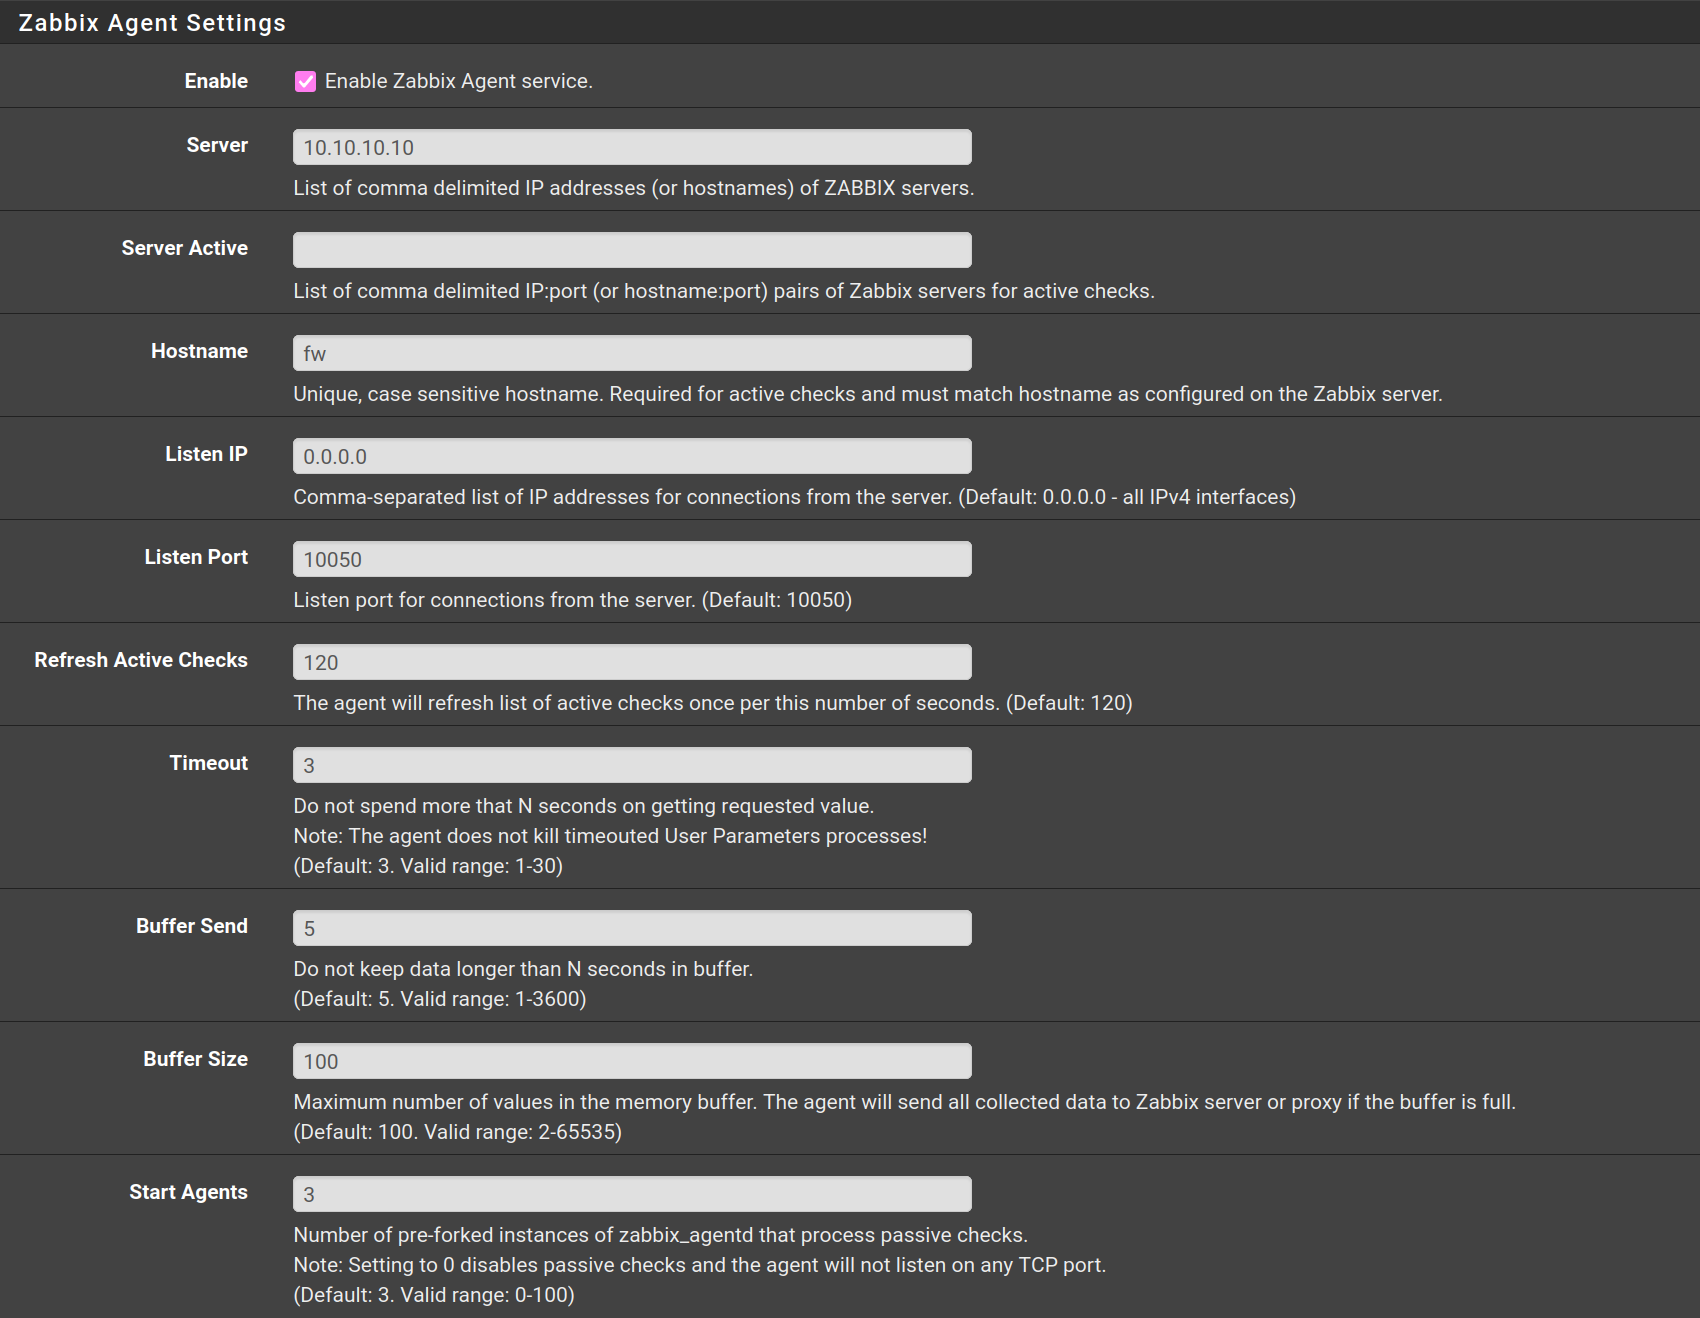
7. Add the Zabbix Server as target for the Zabbix Agent
The agent needs to know the IP of the Zabbix Server. Run sudo sed -i -E "s/^Server=127.0.0.1/Server=10.10.10.10/" /etc/zabbix/zabbix_agentd.conf or edit the file by sudo nano /etc/zabbix/zabbix_agentd.conf and change Server=127.0.0.1 with the IP oh the Zabbix Server Server=10.10.10.10. Restart the Agent sudo /etc/init.d/zabbix_agent restart or sudo systemctl restart zabbix-agent.service
Check the traffic flow sudo tcpdump -vv -i enp2s0 port 10050
Examples
Monitoring pfSense
The most critical and single point of failure is the main gateway / it needs monitoring! Although pfSense is well monitored at the device level it makes sense to use the centralized monitoring appliance for it.
You can do it easy by using the Template SNMP (link) or the Agent.
Configure pfSense
Prerequisites: install the Zabbix Agent 6.2, set the firewall and activate SNMP services by editing the SNMP tab in Services.
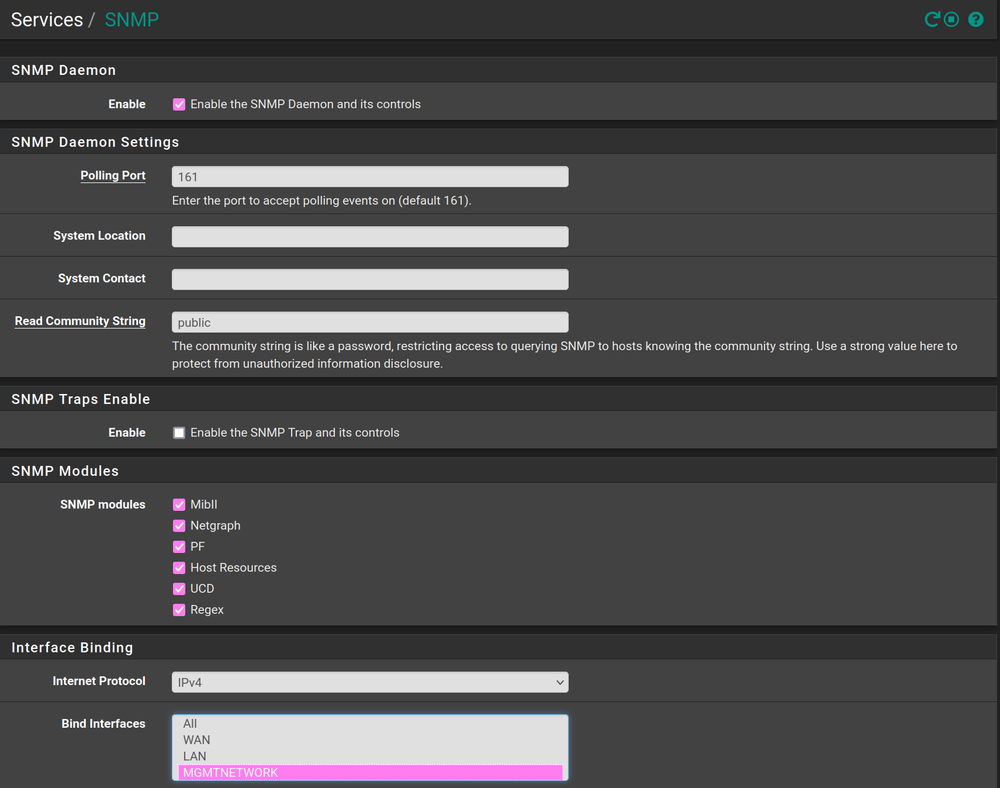
Interface Binding
- Internet Protocol: IPv4
- Bind interfaces: The Management VLAN
or how you can reach the Zabbix Server like LAN. You can also use All
Click on Save to apply the configuration.
Configuring the pfSense Zabbix Agent 6
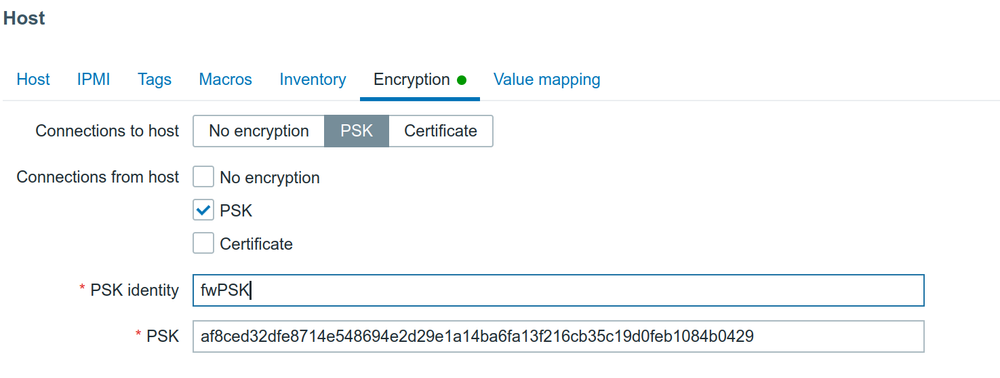
Prerequisites: create PSK (Pre Shared Key) of considerable length and complexity (don't use the example) and a name (up to 128 UTF-8 characters) for it like. TLS related you can choose between psk annd cert but unencrypted is never a good choice for SNMP.
Zabbix recommends as minimum 128-bit (16-byte PSK, entered as 32 hexadecimal digits) and maximum 2048-bit (256-byte PSK, entered as 512 hexadecimal digits).
Generating the PSK
For example, a 256-bit (32 bytes) PSK can be generated using openssl command:
openssl rand -hex 32 af8ced32dfe8714e548694e2d29e1a14ba6fa13f216cb35c19d0feb1084b0429Other things needed
- You need the IP for the Zabbiz Server or use the FQDN
- TLS Identity, a name for the PSK ( using fwPSK )
- TLSPSK ( the Pre Shared Key you created)
You can use a Certificate instead of the PSK. Zabbix can use RSA certificates in PEM format, signed by a public or in-house certificate authority like Let's Encrypt.
Go to Services and Zabbix Agent 6 and configure it:
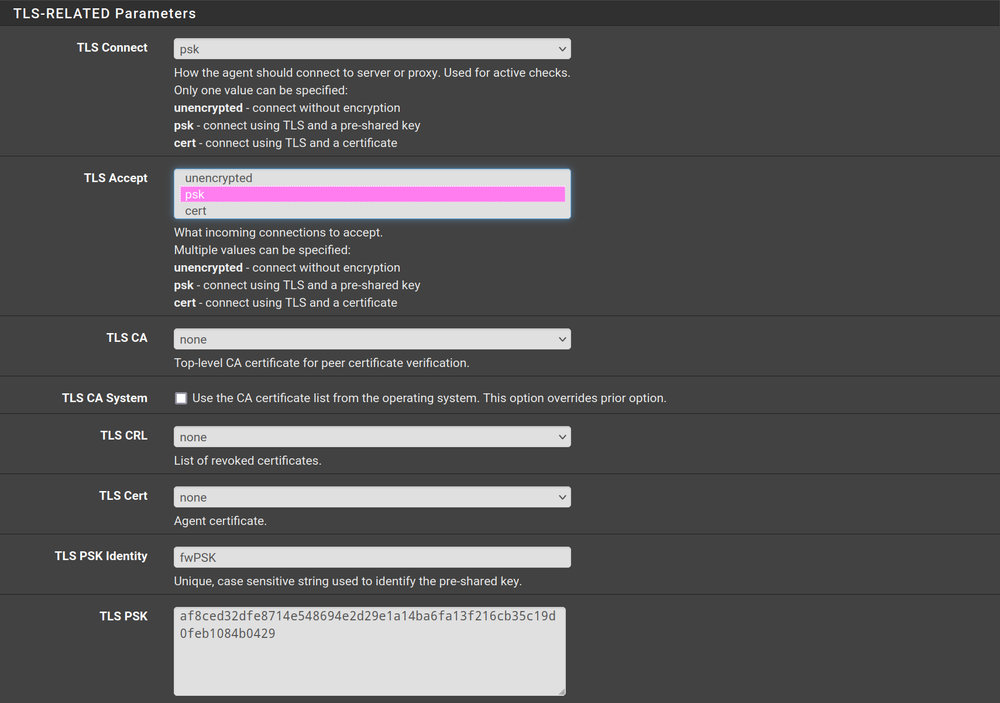
DO NOT set both TLSAccept and TLSConnect,
pick one depending on if your proxy is passive or active.
Click on Save to complete the agent configuration.
Configuring the Zabbix Server
Go to Data collection/Hosts and click on Create Host or click on a discovered host
Host
- Host name: fw ( your hostname as returned by
hostnamecommand) - Templates:
- 1. Use pfSense by SNMP.
- 2. Use FreeBSD by Zabbix Agent
- 3. Download and install a Community Template - Host Groups: Infra or Linux Servers or something else
Using SNMP template
- Interfaces:- Add a new interface
- Type: SNMP
- IP Address: Type the server IP or leave empty
- DNS Name: Type the server FQDN or leave it empty
- Connect to: Select IP or DNS
- Port: 10050
- Description: Do your thing here
- Monitored by Proxy: (no proxy)
Using the Agent
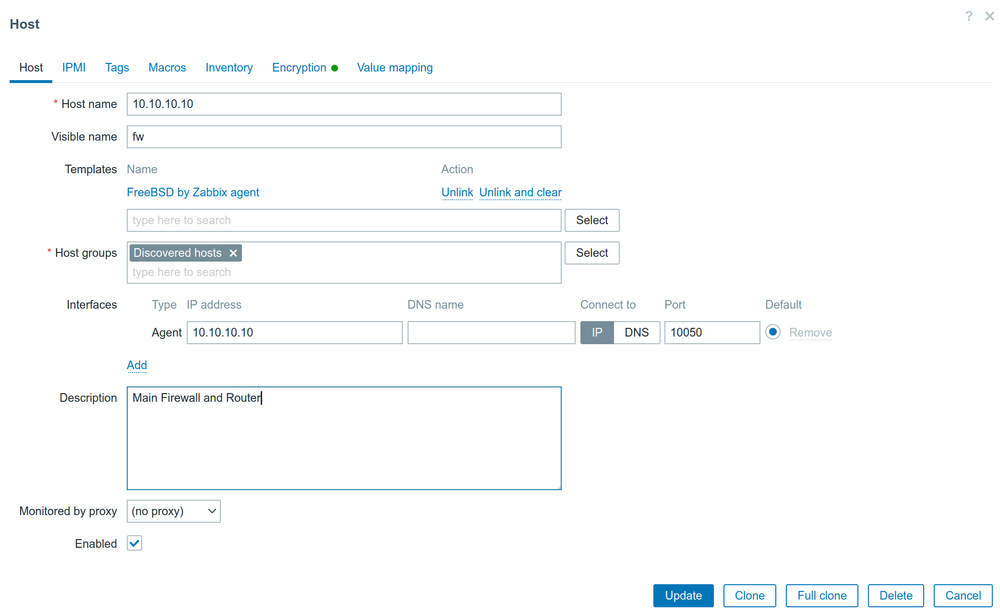
- Interfaces:
- Add a new interface - Type: Agent
- IP Address: Type the server IP or leave empty
- DNS Name: Type the server FQDN or leave it empty
- Connect to: Select IP or DNS
- Port: 10050
- Description: Do your thing here
- Monitored by Proxy: (no proxy)
Encryption
Finish the host creation by clicking Update.
Proxmox host
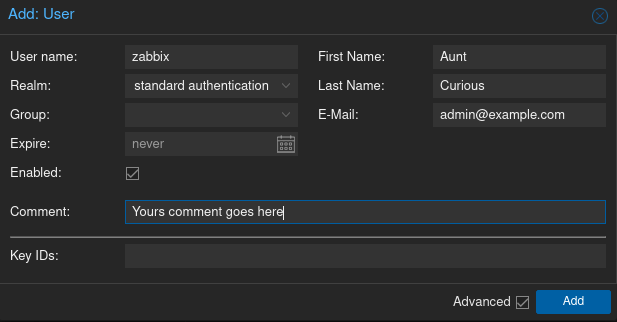
First create a user in Datacenter/Permissions/User
Then add a Security Token in Datacenter/Permission/API Tokens
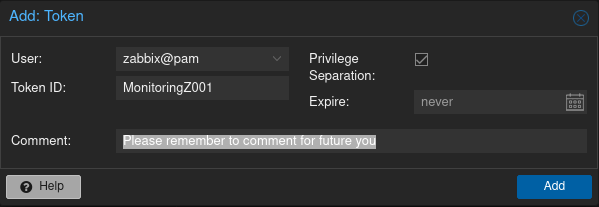
Please record the API token secret - it will only be displayed once!
Create permissions binding the user and the token to an actual resources on the Proxmox in Permissions submenu, Add/API Token permission
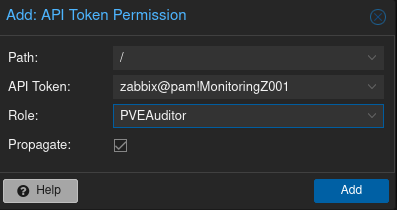
Then add it to all nodes and VMs in the cluster
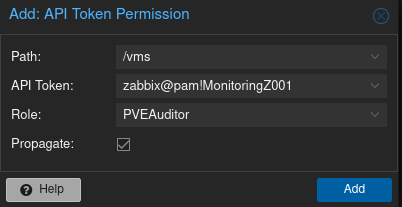
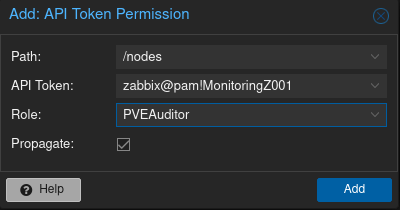
Then add the same Privileges to the User.
Configure Zabbiz to monitor Proxmox
When your cluster is running. Go to Data Collection/Hosts and select your agent, Proxmox VE by HTTP. This will link the template to your agent.
The last step is setting the Proxmox API token information in the plugin so that it can connect to the server and fetch metadata. Click on Macros tab. We will need to add 2 macros related to credentials. Click on Add and fill in the new row as follow:
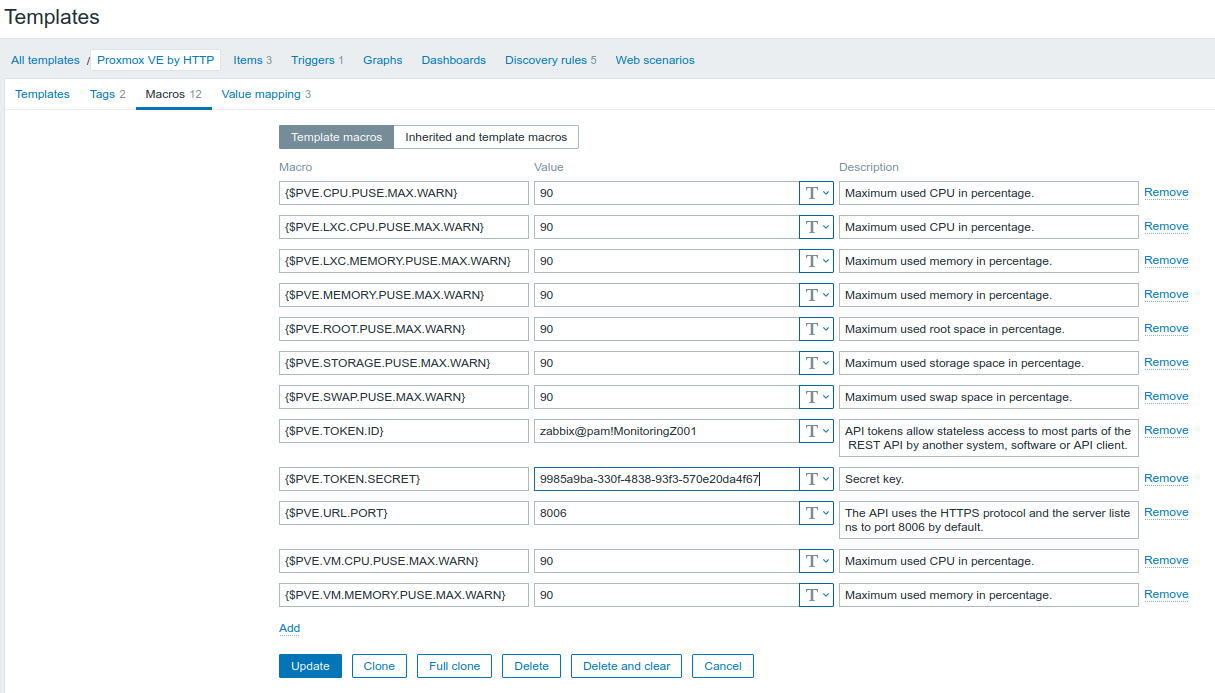
- Macro: {$PVE.TOKEN.ID}
- Value: Type your Token ID
- Description: A helpful description or leave it empty
Click on Add again
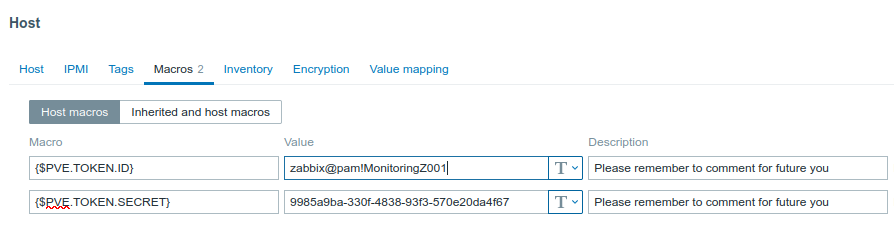
- Macro: {$PVE.TOKEN.SECRET}
- Value: Type your Token password
- Description: A helpful description or leave it empty
That is it, let’s try it. Go to Monitoring >> Latest data. In the filter section, type the name of your Proxmox server in the Hosts box, Proxmox in the Name box and finally hit Apply. A list of items should be displayed for it, such as Proxmox: API service status, etc
References
Zabbix [1] Templates [2] Installation documentation [3] Generate a strong password [4] How strong is your password [5]