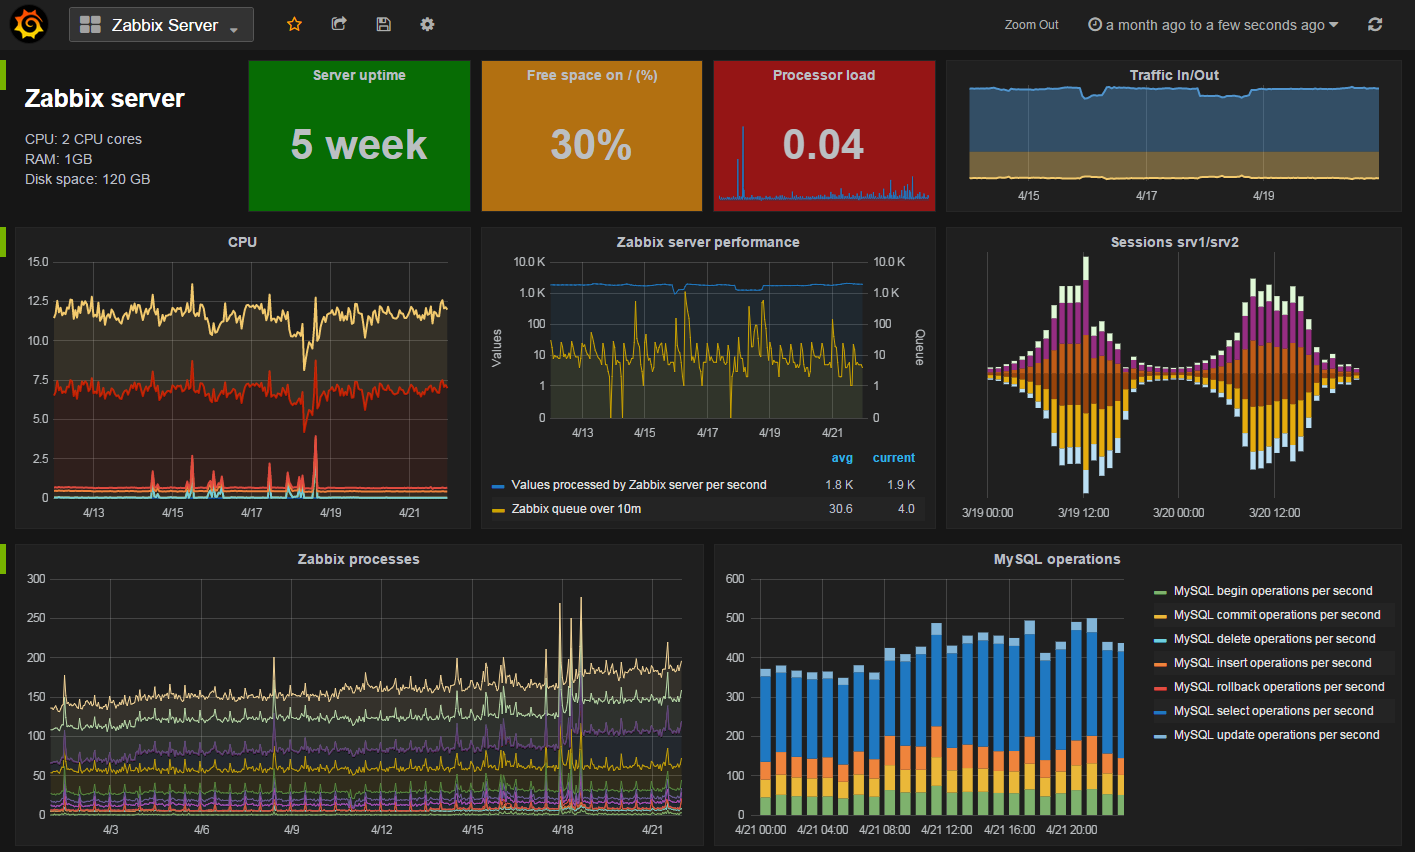
Monitoring Servers with Graphs
Monitoring Servers and VM's before tweaking VM's is one of the most fundamental tasks. Running thousands of pods on a server it's better to follow their performance. With tiny clusters it's vital to know whats going on. For this post we setup #Zabbix and #Grafana

I have shown different ways of monitoring Servers and VM's before in 2 posts Monitoring your Servers and Monitoring Proxmox. Why a third post?
Tweaking VM/CT's is one of the most fundamental and most productive tasks.
You should act, not react on issues.
When running thousands of pods on a server, it's better to follow the node's performance.
With tiny clusters, it's vital to exactly know what's going on to be able to be preventive with possible issues and to be able to harden your Servers.
For this post, we set up a VM/CT for performing the data gathering with Zabbix and showing graphs with Grafana
Set up your VM or CT
If it's to face the web use a VM totally internal, use a CT
Create a VM template and some VM's
See my post on Proxmox Automation.
wget https://raw.githubusercontent.com/nallej/MyJourney/main/myTemplateBuilder.shSet up the basic services like Docker
wget https://raw.githubusercontent.com/nallej/MyJourney/main/myVMsetup.shAdd my add-ons for bash
wget https://raw.githubusercontent.com/nallej/MyJourney/main/BashAddon.shTest the CT/VM and do update/upgrade
apt update && apt dist-upgrade -y
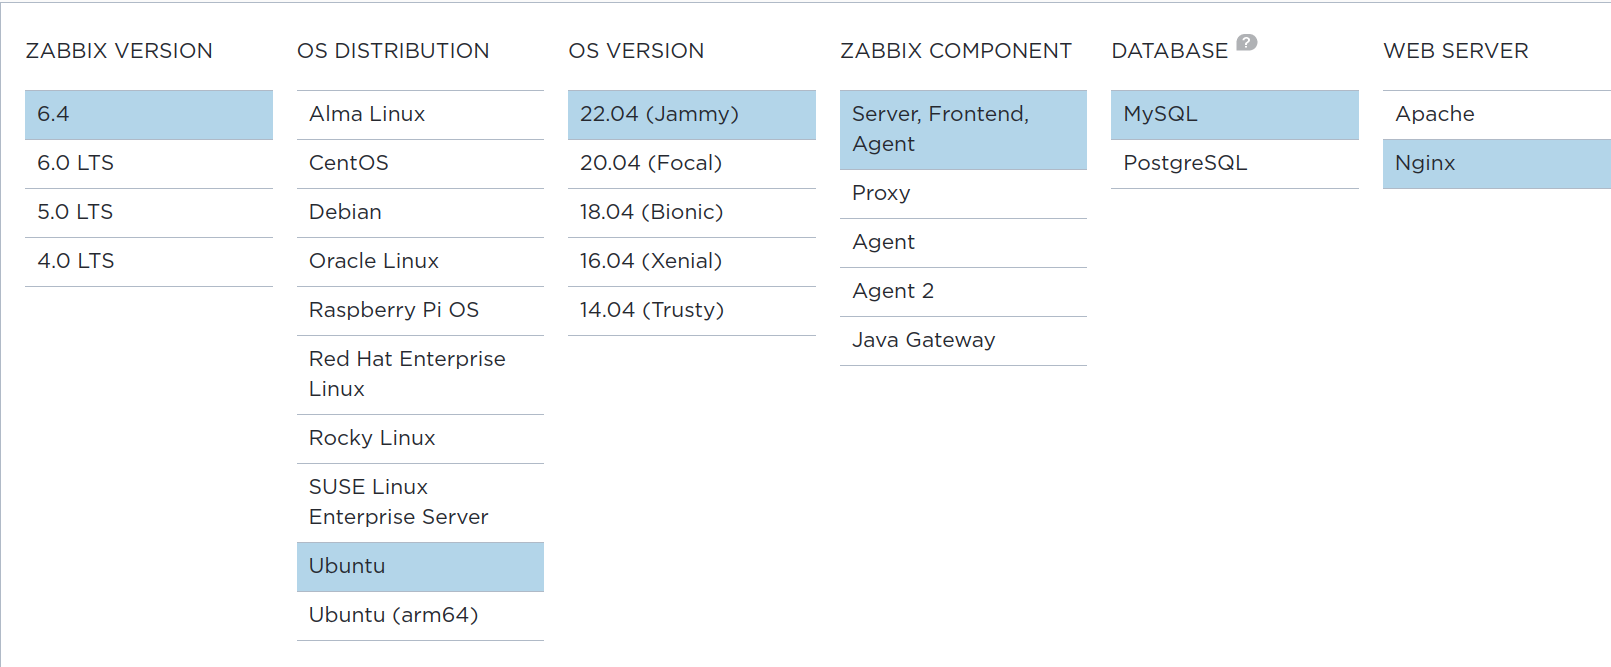
Install Zabbix
Install Zabbix Server (there are many ways to do it, see the Zabbix Home page). Download by choosing Zabbix Version, VM OS, Component, DB and Web Server form Download page. You will be guided by the choices made by you.
Install and configure Zabbix
Install Zabbix repository for your platform
You can find more info at the Zabbix Documentation
wget https://repo.zabbix.com/zabbix/6.4/ubuntu/pool/main/z/zabbix-release/zabbix-release_6.4-1+ubuntu22.04_all.deb
dpkg -i zabbix-release_6.4-1+ubuntu22.04_all.deb
Install the Zabbix server, front-end and the agents
apt install zabbix-server-mysql zabbix-frontend-php zabbix-nginx-conf zabbix-sql-scripts zabbix-agentCreate initial database
Create a strong password and remember it.
Install a MariaDB. Read more at Documentation
sudo apt install mariadb-server mariadb-client -y
Do a secure installation of MariaDB
You will be asked for:
- use Unix Socket
- a new password for root
- to remove anonymous users
- to disallow remote login for root
- to remove the test DB
sudo mysql_secure_installationMake sure you have a database server up and running.
Create your database
Switch to the MySQL server prompt and create the initial database. Use strong password.
mysql -uroot -pAnd do this:
create database zabbix character set utf8mb4 collate utf8mb4_bin;create user zabbix@localhost identified by <your_zabbix_mysql_password>;grant all privileges on zabbix.* to zabbix@localhost;set global log_bin_trust_function_creators = 1;quit;
On the Zabbix server host import the initial schema and data
You will be prompted to enter your newly created password.
zcat /usr/share/zabbix-sql-scripts/mysql/server.sql.gz | mysql --default-character-set=utf8mb4 -uzabbix -p zabbix Disable log_bin_trust_function_creators option
Needed after importing the database schema.
mysql -uroot -pAnd do this>
set global log_bin_trust_function_creators = 0;quit;
Configure the database for the Zabbix server
nano /etc/zabbix/zabbix_server.conf

DBPassword=password
Configure NginX for Zabbix
Edit file /etc/zabbix/nginx.conf uncomment and set 'listen' to anything you like (avoid common ports like 80/3000) and 'server_name' your_domain directives.
 nano /etc/zabbix/nginx.conf
 uncomment and set 'listen' and 'server_name' directives.
Test and reload
sudo nginx -t
sudo nginx -s reload
Now you can find the Zabbix page at the <IP> or <ServerName>:<port>
Configure PHP for Zabbix frontend
Add a line to the end with your local TZ
sudo nano /etc/zabbix/php-fpm.conf

php_value[date.timezone] = Europe/Riga


sudo systemctl restart php8.1-fpm.service
sudo systemctl start zabbix-server

sudo systemctl status zabbix-server
Add a line: php_value[date.timezone] = Europe/Dublin
Then restart the following:
sudo systemctl restart php8.1-fpm.servicesudo systemctl start zabbix-server
And check Zabbix service is running
sudo systemctl status zabbix-server
Start Zabbix server and agent processes
sudo systemctl restart zabbix-server zabbix-agent nginx php8.1-fpm
sudo systemctl enable zabbix-server zabbix-agent nginx php8.1-fpm
Login as Admin with password zabbix and do the Configurations.
If you get locale errors, see Zabbix Documentation how to fix.
Add the Agent
Example: Proxmox, apt-get install zabbix-agent
Add Grafana for even more graphics
Create a docker-compose.yml file. With, may alias start with updcl.
Start it by docker-compouse && docker-compose -l (the second part is for starting the logs on your terminal). See my script.
Or create a new Stack in Portainer called grafana or something.
---
services:
  grafana:
    container_name: grafana
    image: grafana/grafana-oss:latest
    ports:
      - 3000:3000

    restart: unless-stopped
Add anything you need like your networks and volumes.
Start the container and go to the page 192.0.2.40:3000 and login as admin with password admin and change the password and re-login and start configuration.
IANA Documentation network 192.0.2.0/24, our server is 192.0.2.40
Go to Administration/Plugins and search for the Zabbix plugin. Install it and re-start Grafana and enabled it. Then configure it to your needs. For more details, read Configuring and Getting Stated Guide
Add a new Data Source Zabbix