Making network drawings
Documentation of networks and process integration is key to run a #homelab. #diagrams.net/#draw.io is an open source technology stack for building diagramming applications, and the world’s most widely used browser-based end-user diagramming software.


You can use draw.io on the web or host it yourself. Draw.io diagramming applications are the leading solutions for web based sketching and diagramming functionality.
Network and systems documentation has always been a mandatory task for the system designers. Factories had these drawing hang on the walls all over the place and business had them in the on the computer room walls. We used to draw them by hand in A4 or A3. Then they made them into A0 size.
The system is not delivered before it's documentation is approved
Today we draw everything on our screens. Draw.io is one of the fundamental tools you need to document processes and networks. You can integrate links for easy access to yore assets and apps. You can use it for many more things with the wast number of add-ons. It does also many other diagrams and integrates with a large number of systems and apps.
- Atom: Atom has a package that lets you edit draw.io diagrams directly within the text editor.
- Grafana: Add diagrams to this analytics and modelling platform with Arnaud Genty’s open-source plugin.
- Redmine: Create diagrams in your project documentation in Redmine, a project management web application, based on Ruby on Rails.
- Nextcloud: Create diagrams from within Nextcloud, a file sharing and communication platform, thanks to app developer Pawel Rocek.
- VS Code: Edit and manage diagrams directly inside VS Code. See how to use the VS Code extension with github.dev
... and many many more.
I have usually been using the web version but have had it on my servers from time to time. Today I installed it in a small container on my Proxmox Datacenter in a #ubuntu vm (32G 4 core) alongside 10 other apps. I started a documentation of my network - finally.
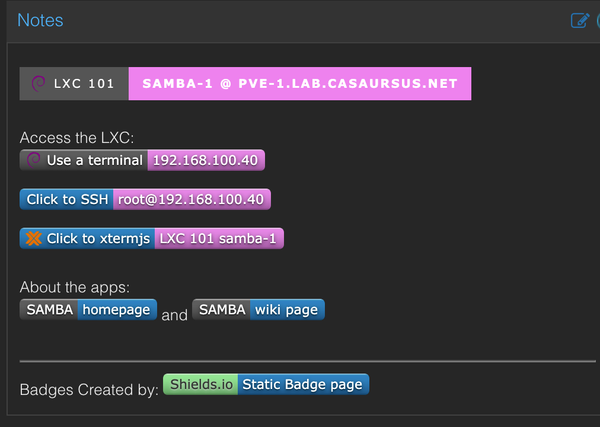
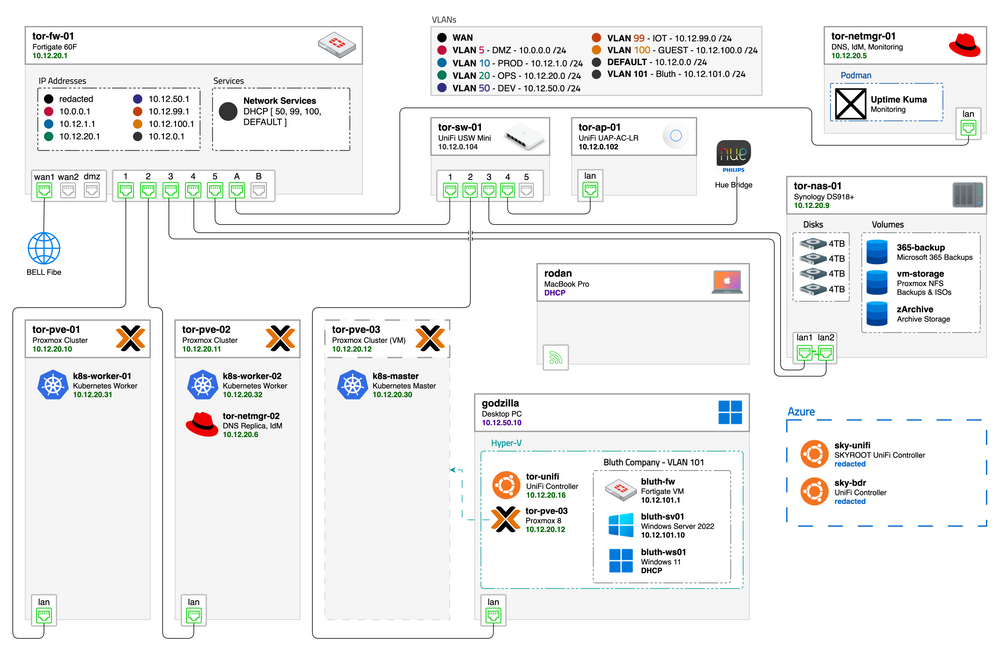
A Proxmox HomLab
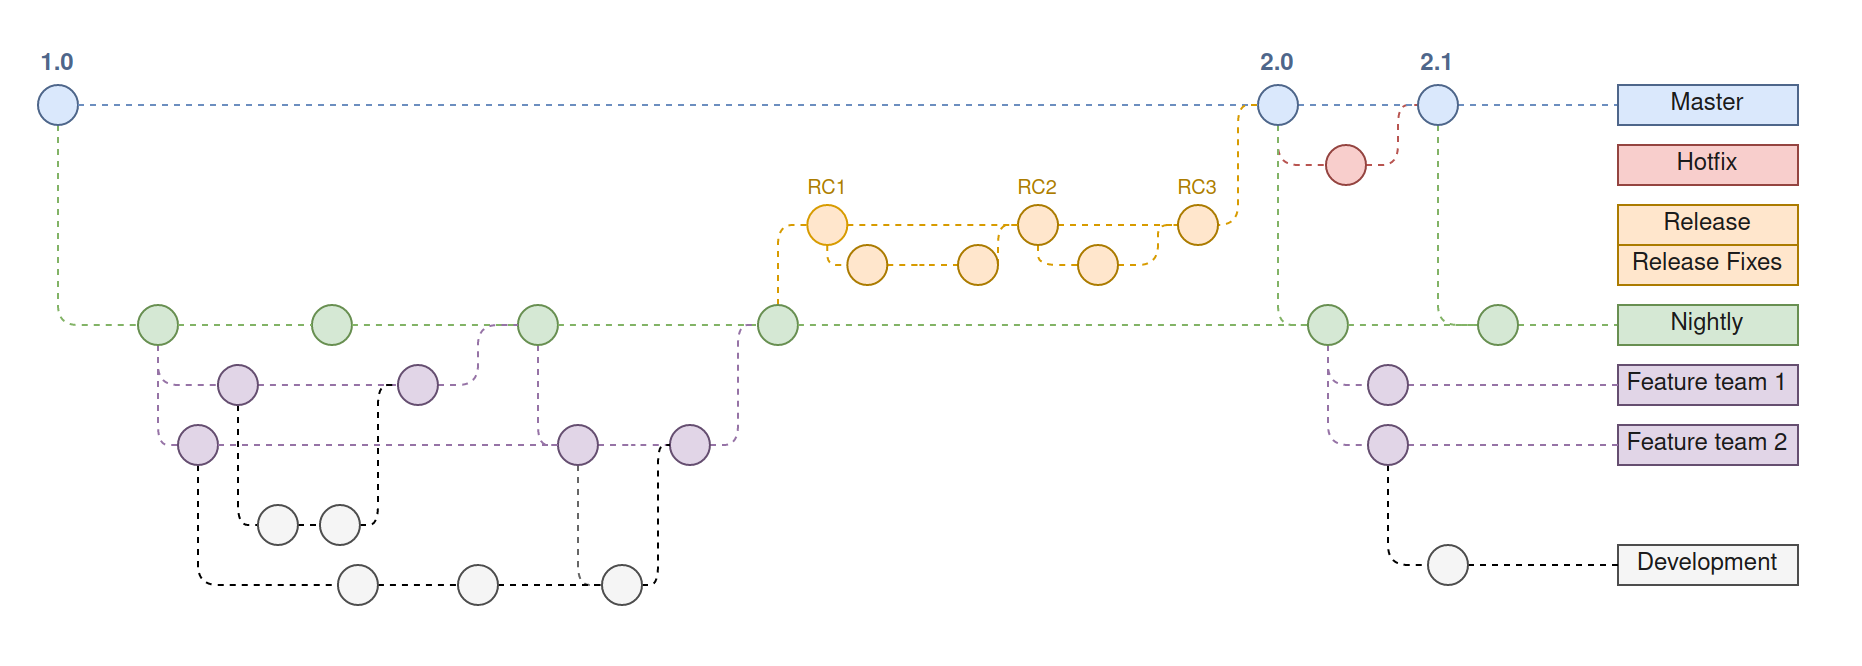
Or draw SW diagrams
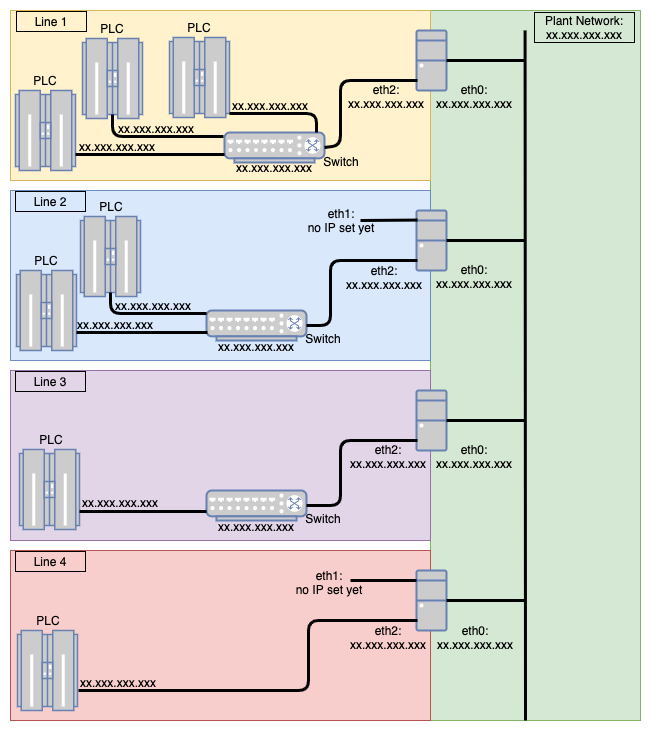
Or draw Industrial Networking
And there is many more things you can draw with this fantastic tool.
This is what we need
A small container on our server. More at this link.
### draw.io
---
version: '3.5'
services:
  drawio:
    image: jgraph/drawio
    container_name: drawio
    restart: unless-stopped
    ports:
      - 8080:8080
      - 8443:8443
    networks:
      - kadulla
#    environment:
#      PUBLIC_DNS: domain
#      ORGANISATION_UNIT: unit
#      ORGANISATION: org
#      CITY: city
#      STATE: state
#      COUNTRY_CODE: country
#    healthcheck:
#      test: ["CMD-SHELL", "curl -f http://domain:8080 || exit 1"]
#      interval: 1m30s
#      timeout: 10s
#      retries: 5
#      start_period: 10s

# Internal networks
networks:
  kadulla:
    external: true
...
Use placeholders to automate your diagrams
Looking at a somewhat more practical example - you can use placeholders in labels in your infrastructure diagrams. Then, when you change the address of the subnet group, the individual node IP addresses will update automatically. Learn how to draw.io.
In the example below, the labels on the individual nodes inside the subnet use a placeholder which references the custom subnet property of the containing oval shape. This makes it easy to update the IP addresses in that subnet.
Other uses
This is a extremely versatile application with tons of features and use cases.
You can layer things, add plugins, integrate with many programs and system. You You can do Ishikawa, SW planning, Floor plans, Network drawings as static or interactive, Mindmaps, PERT, Venn and Gant charts, Flowcharts, Infografics ...
Self host - run on the web - buy as service. It's up to you.
Your imagination is the limit.